For my graduation project at the Media technology programme at Leiden University, I wanted to research how microscopy data from the biological sciences could be transformed into an animation. Through a case-study approach, I have tried to develop a method of transforming cryo-electron tomography data into the 3D format used by sophisticated 3D modelling- and animation software.
The most important tangible products resulting from this study are displayed on this page. The products are referred to in the accompanying paper that you can access by copying the link below: https://www.dropbox.com/s/99fmit0phib7r6g/Making%20Science%20Tangible_VeraWilliams_Graduation%20thesis_Final.pdf?dl=0

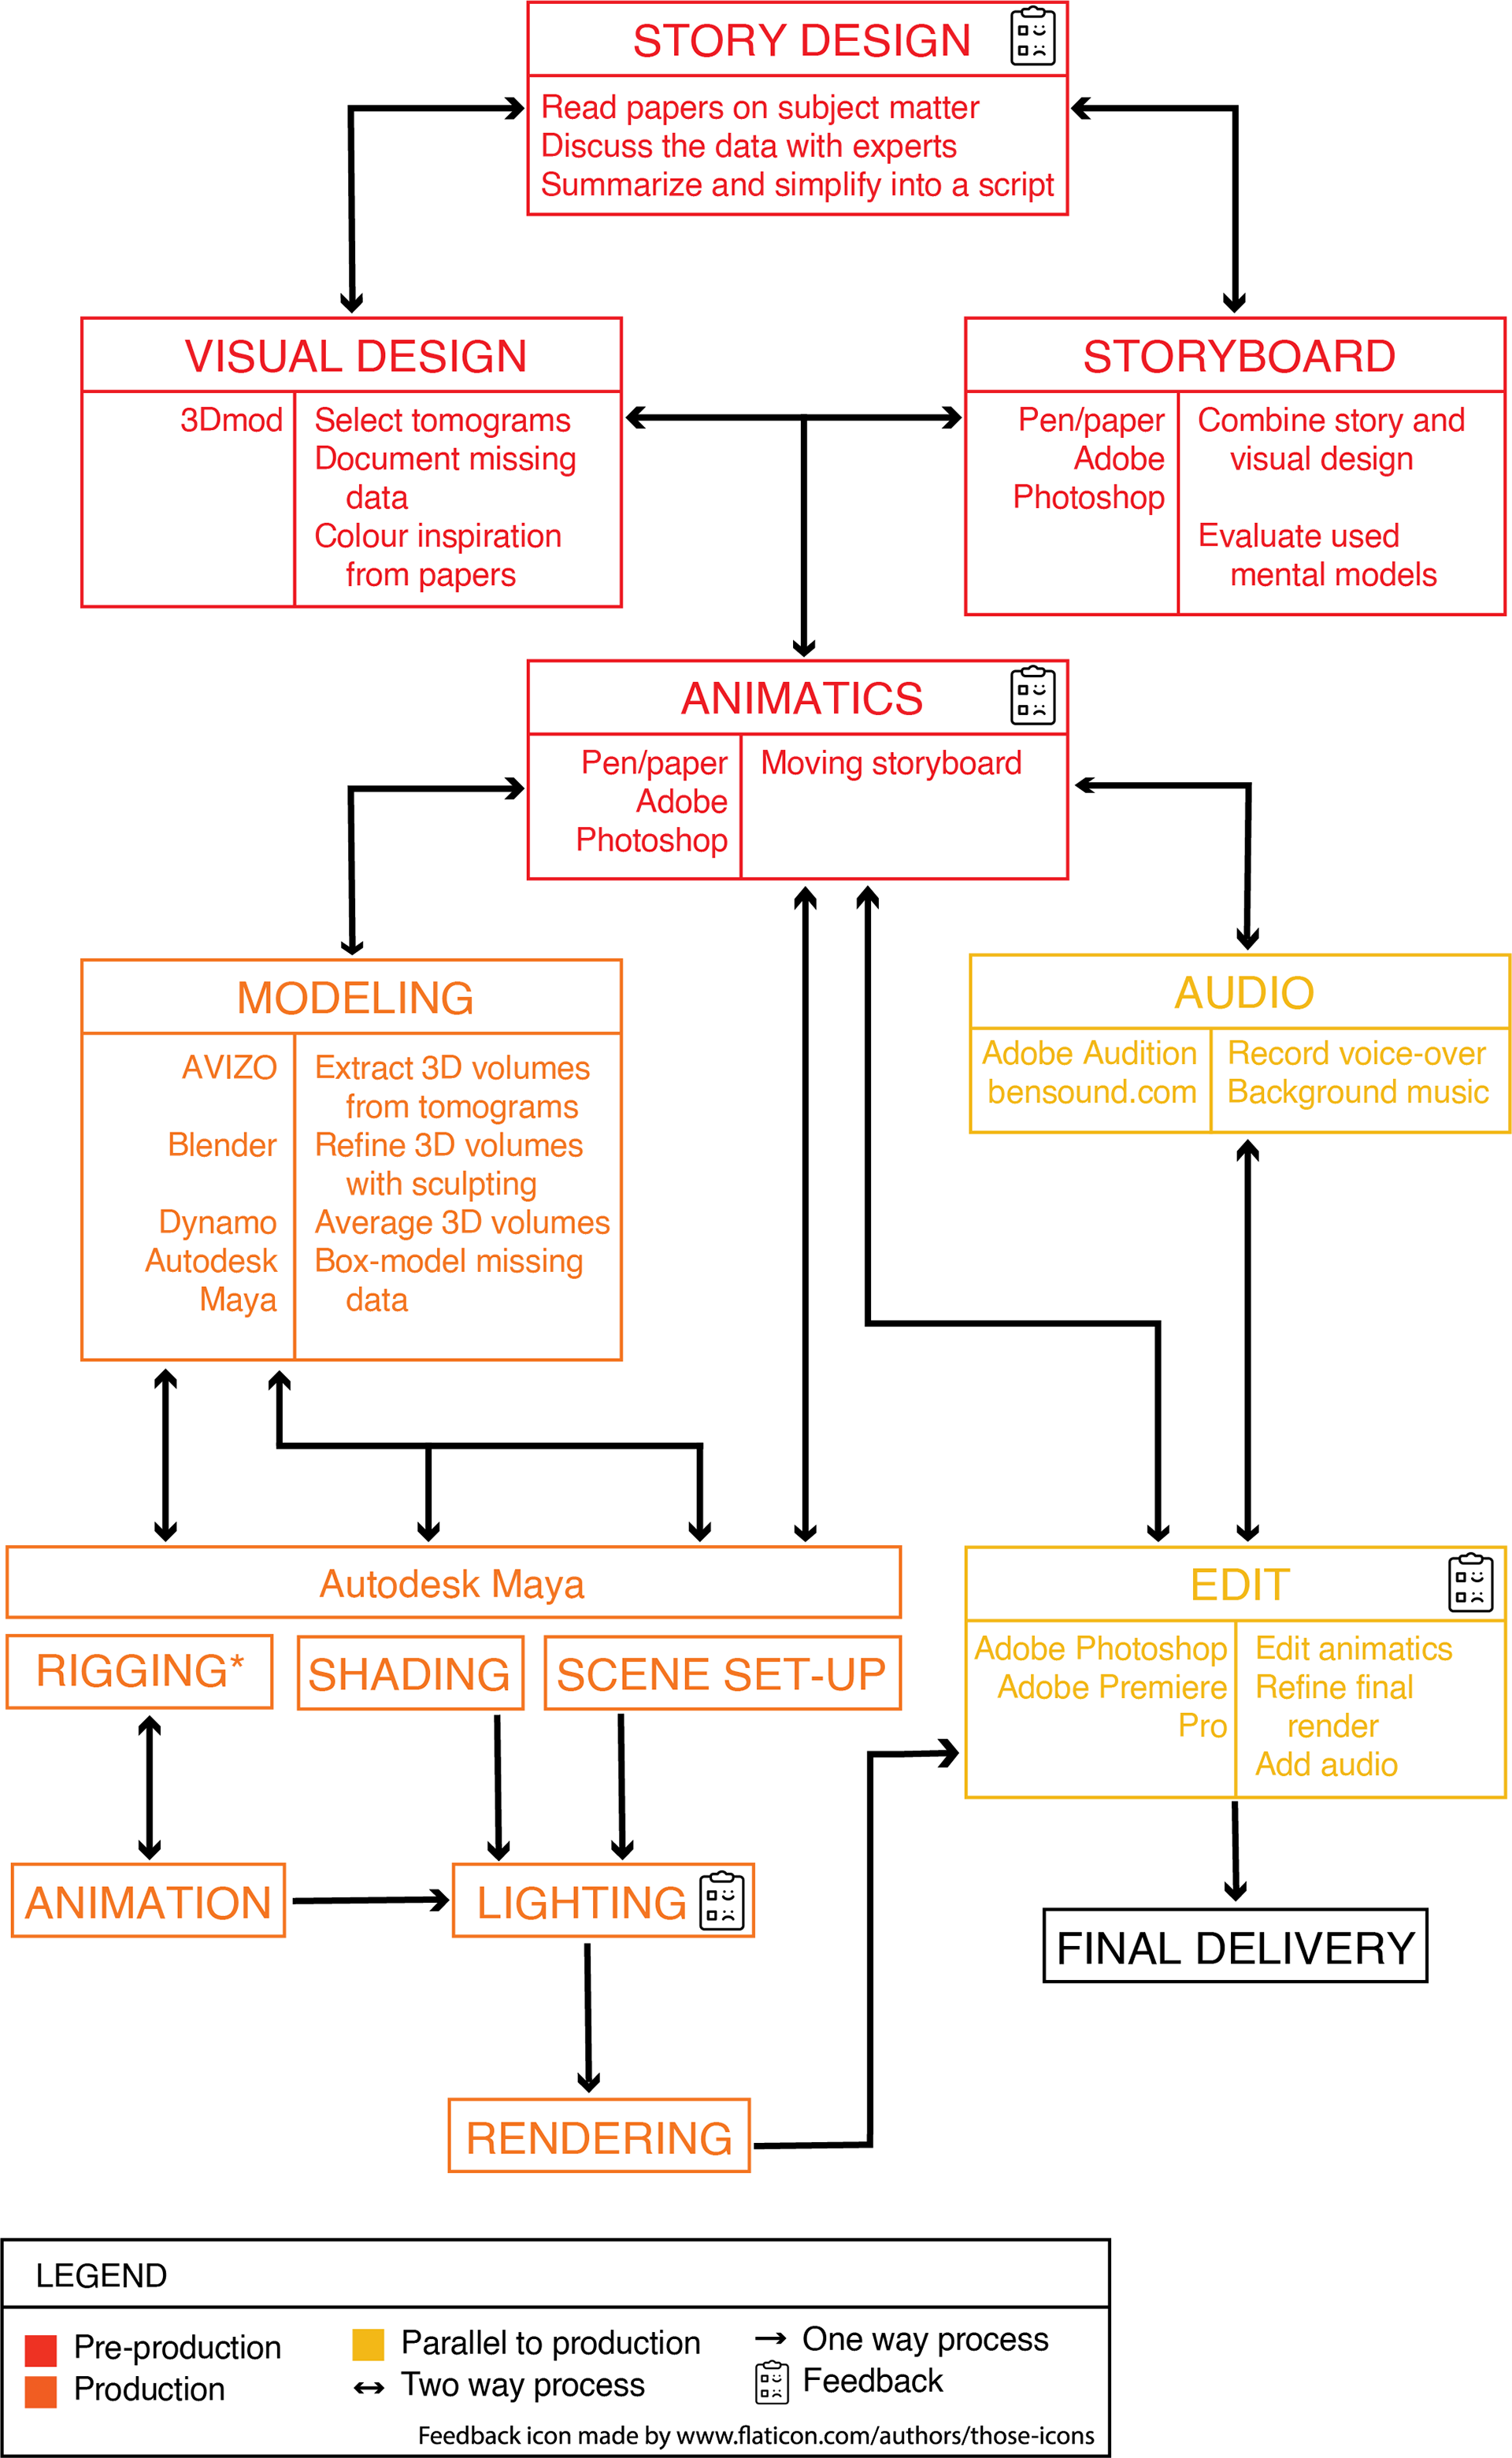
This is the workflow that resulted from the research. It is based on the flowchart by William Vaughan (2012) on 3D animation. The elements from the fields of imaging technology and microbiology have been added to create a workflow aimed specifically at developing scientific animations from cryo-EM data.

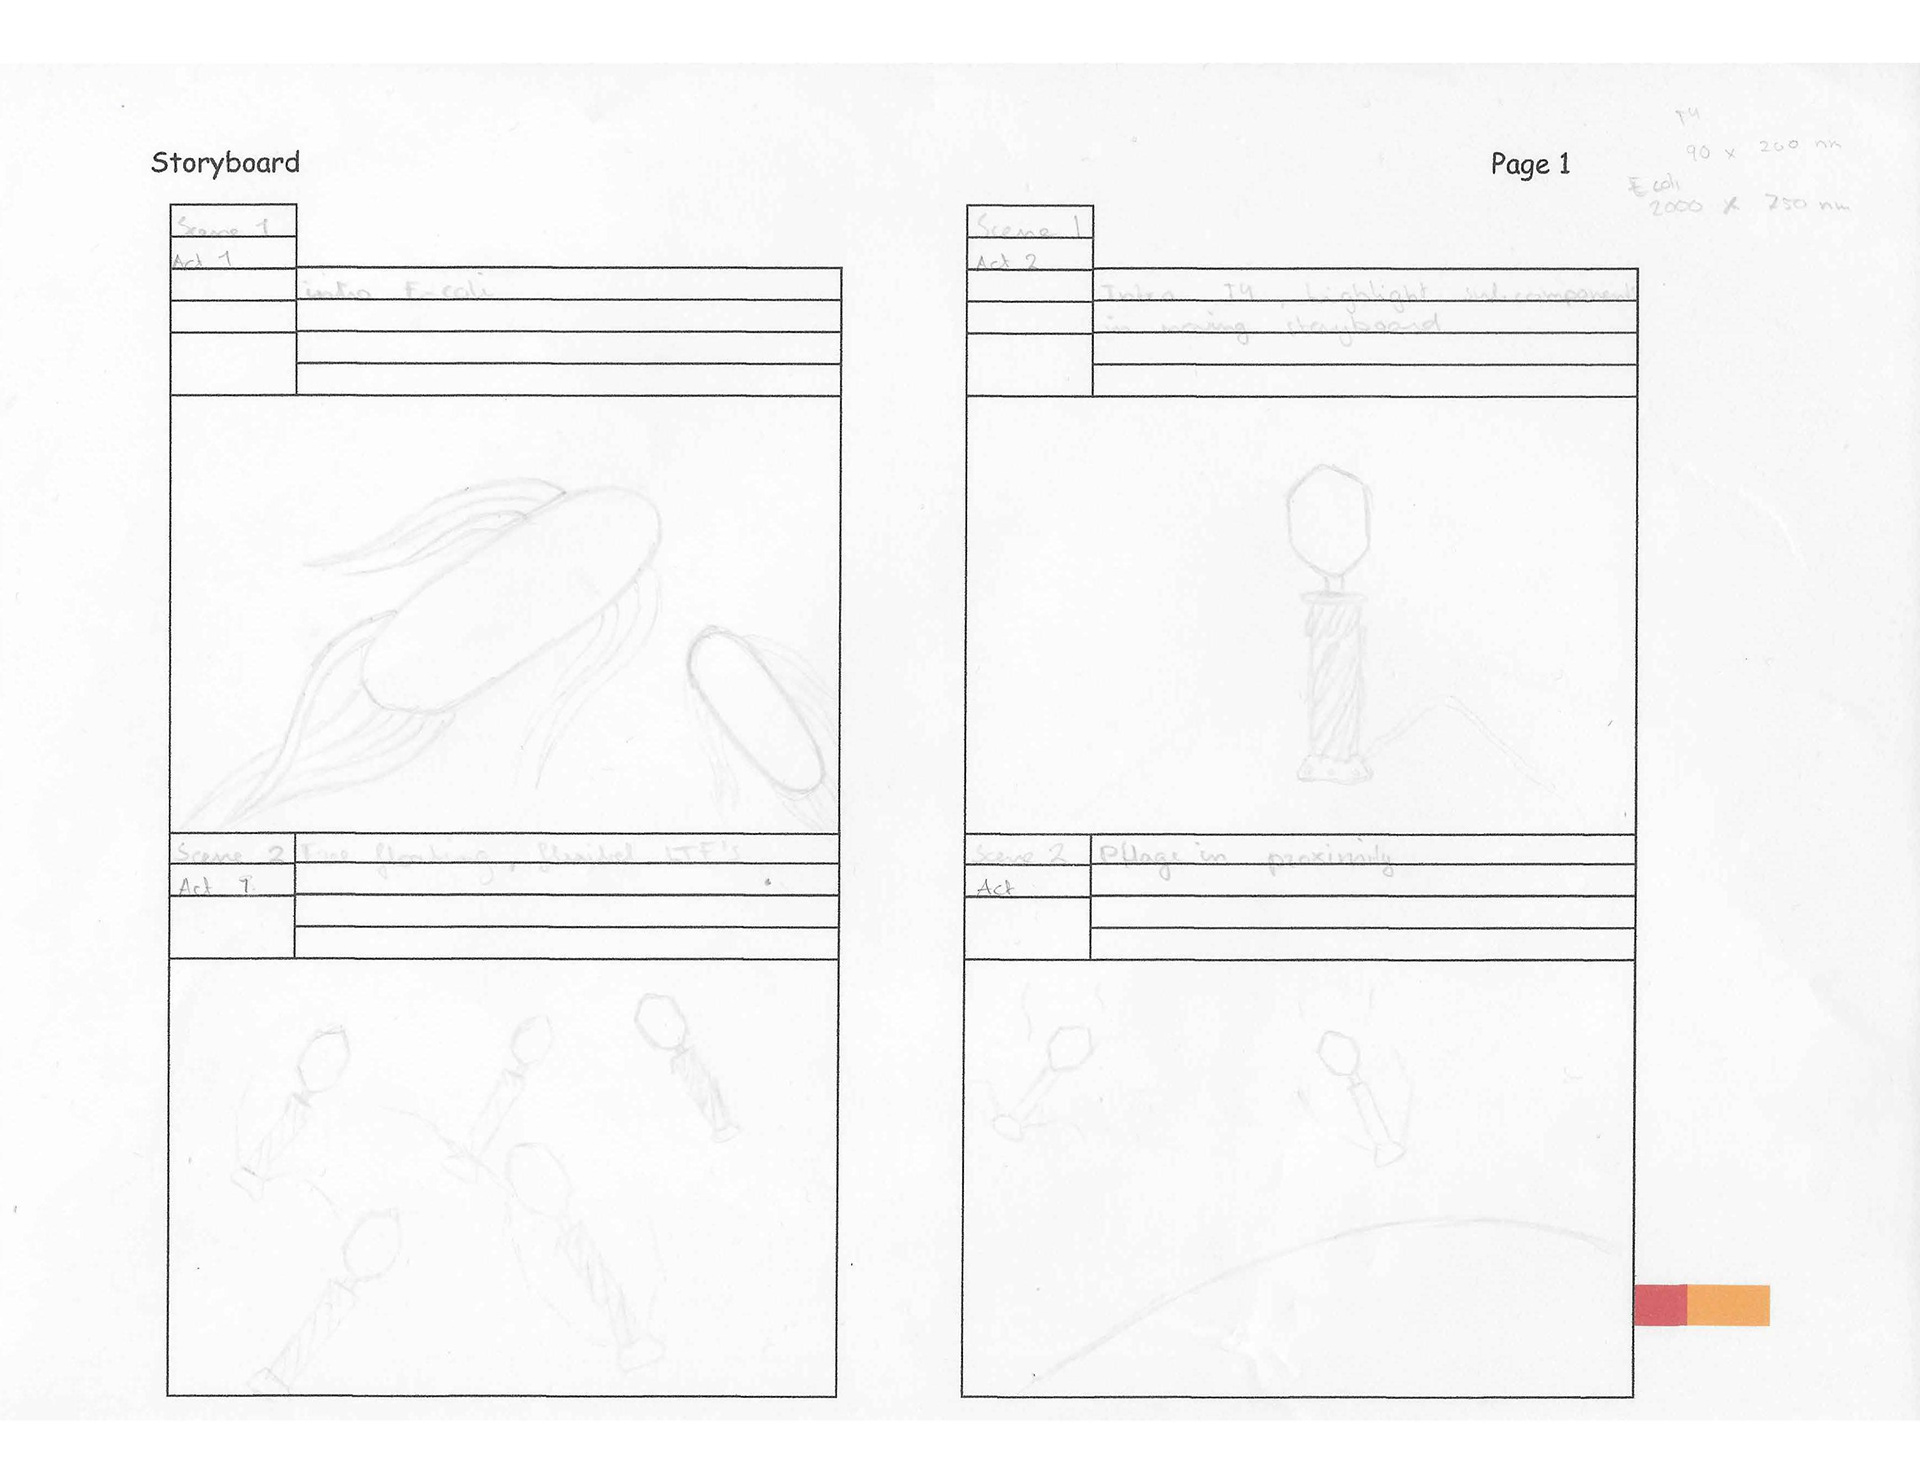
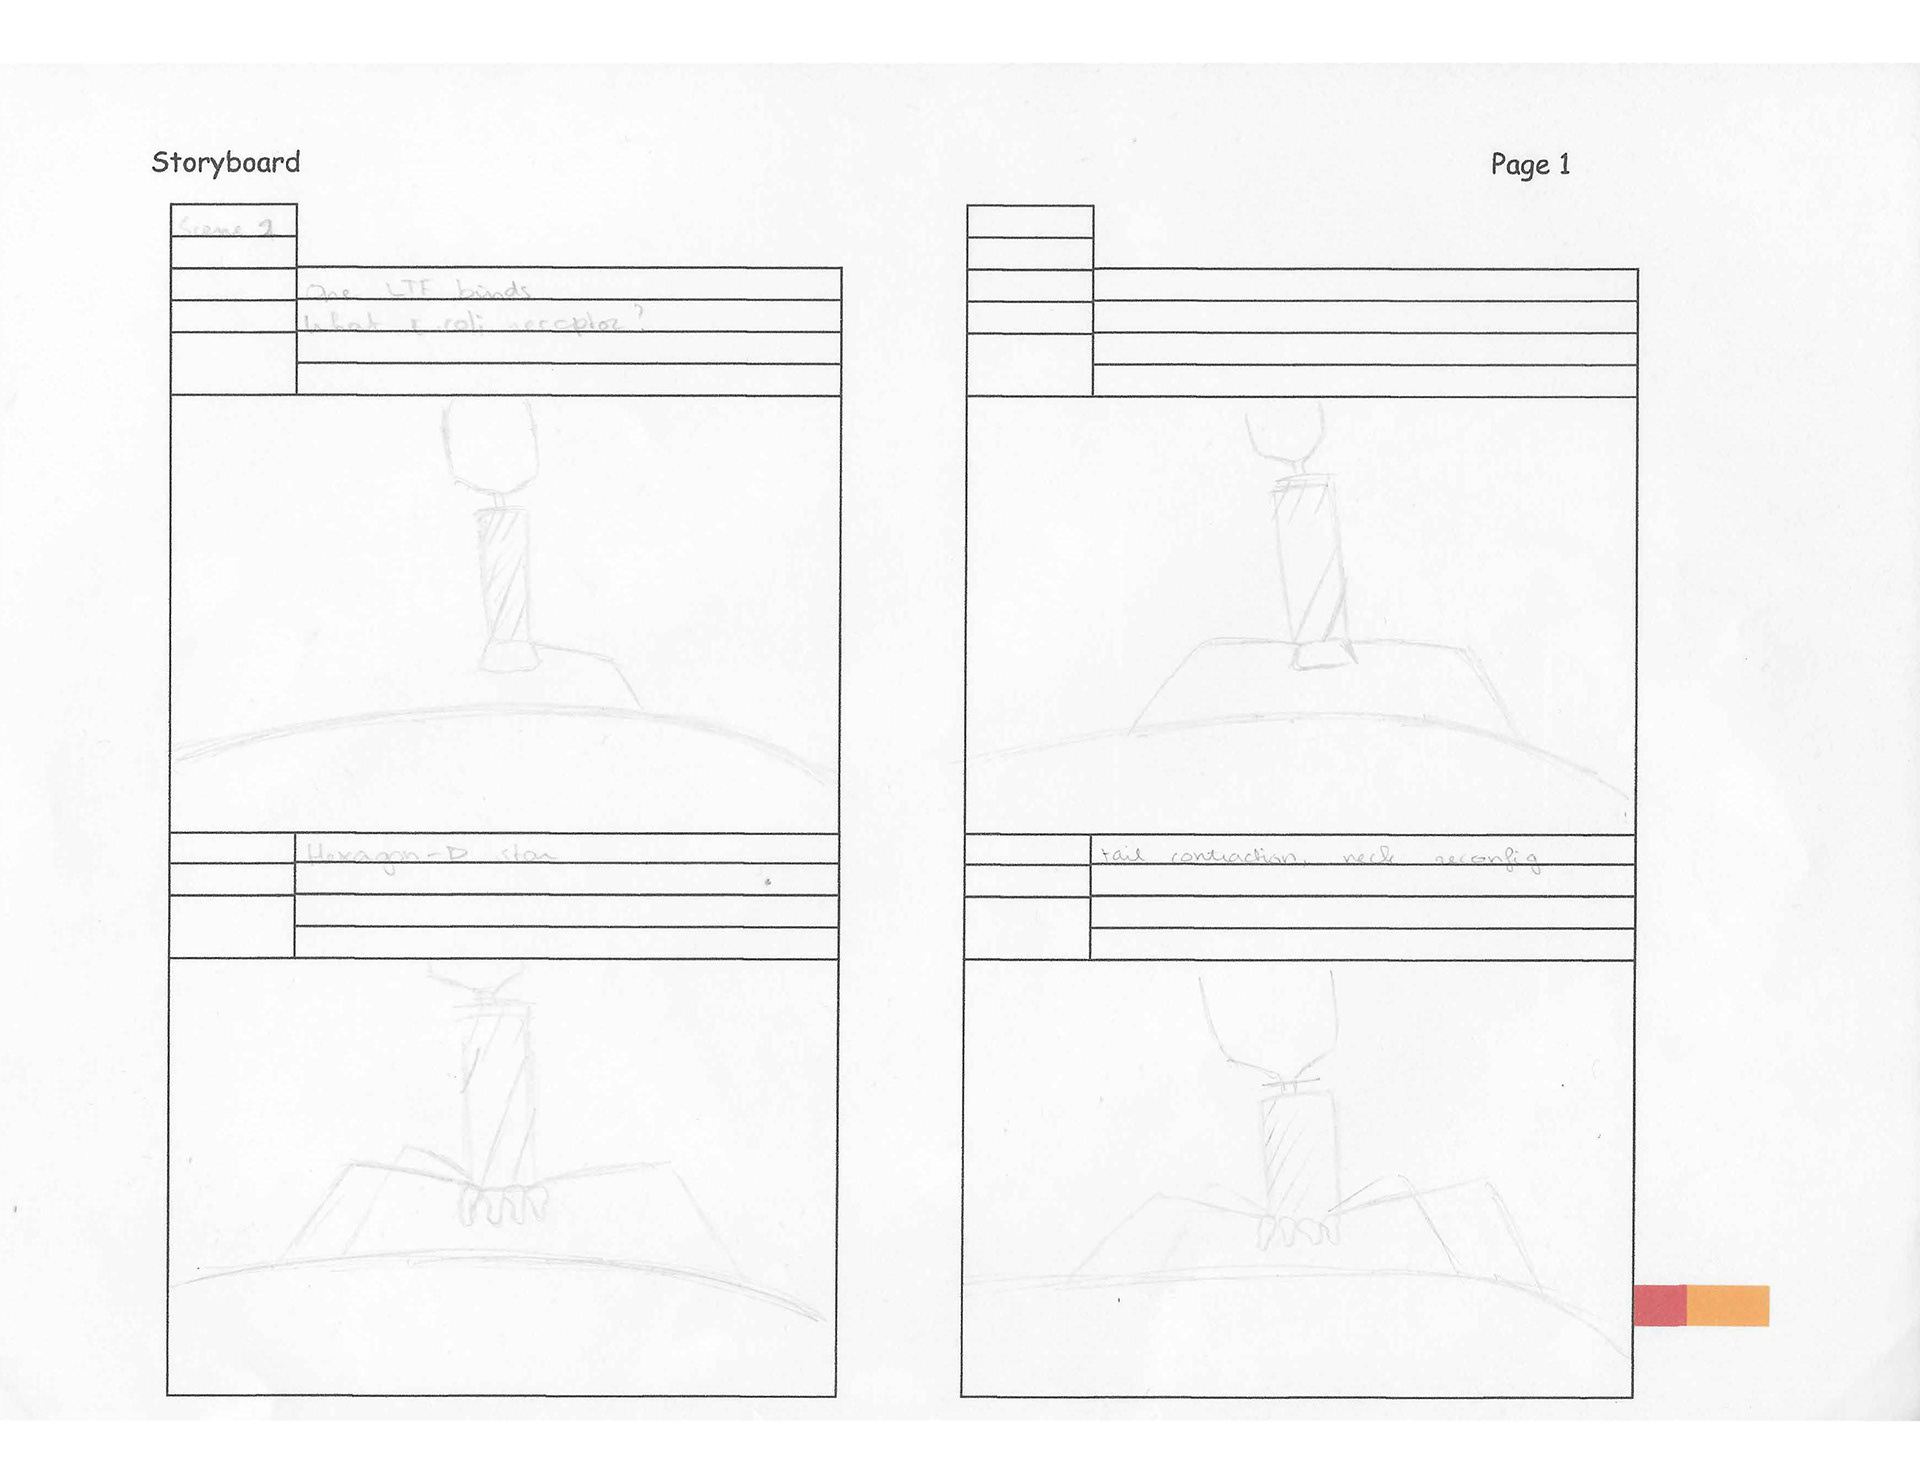
T4 bacteriophage infection script & storyboard
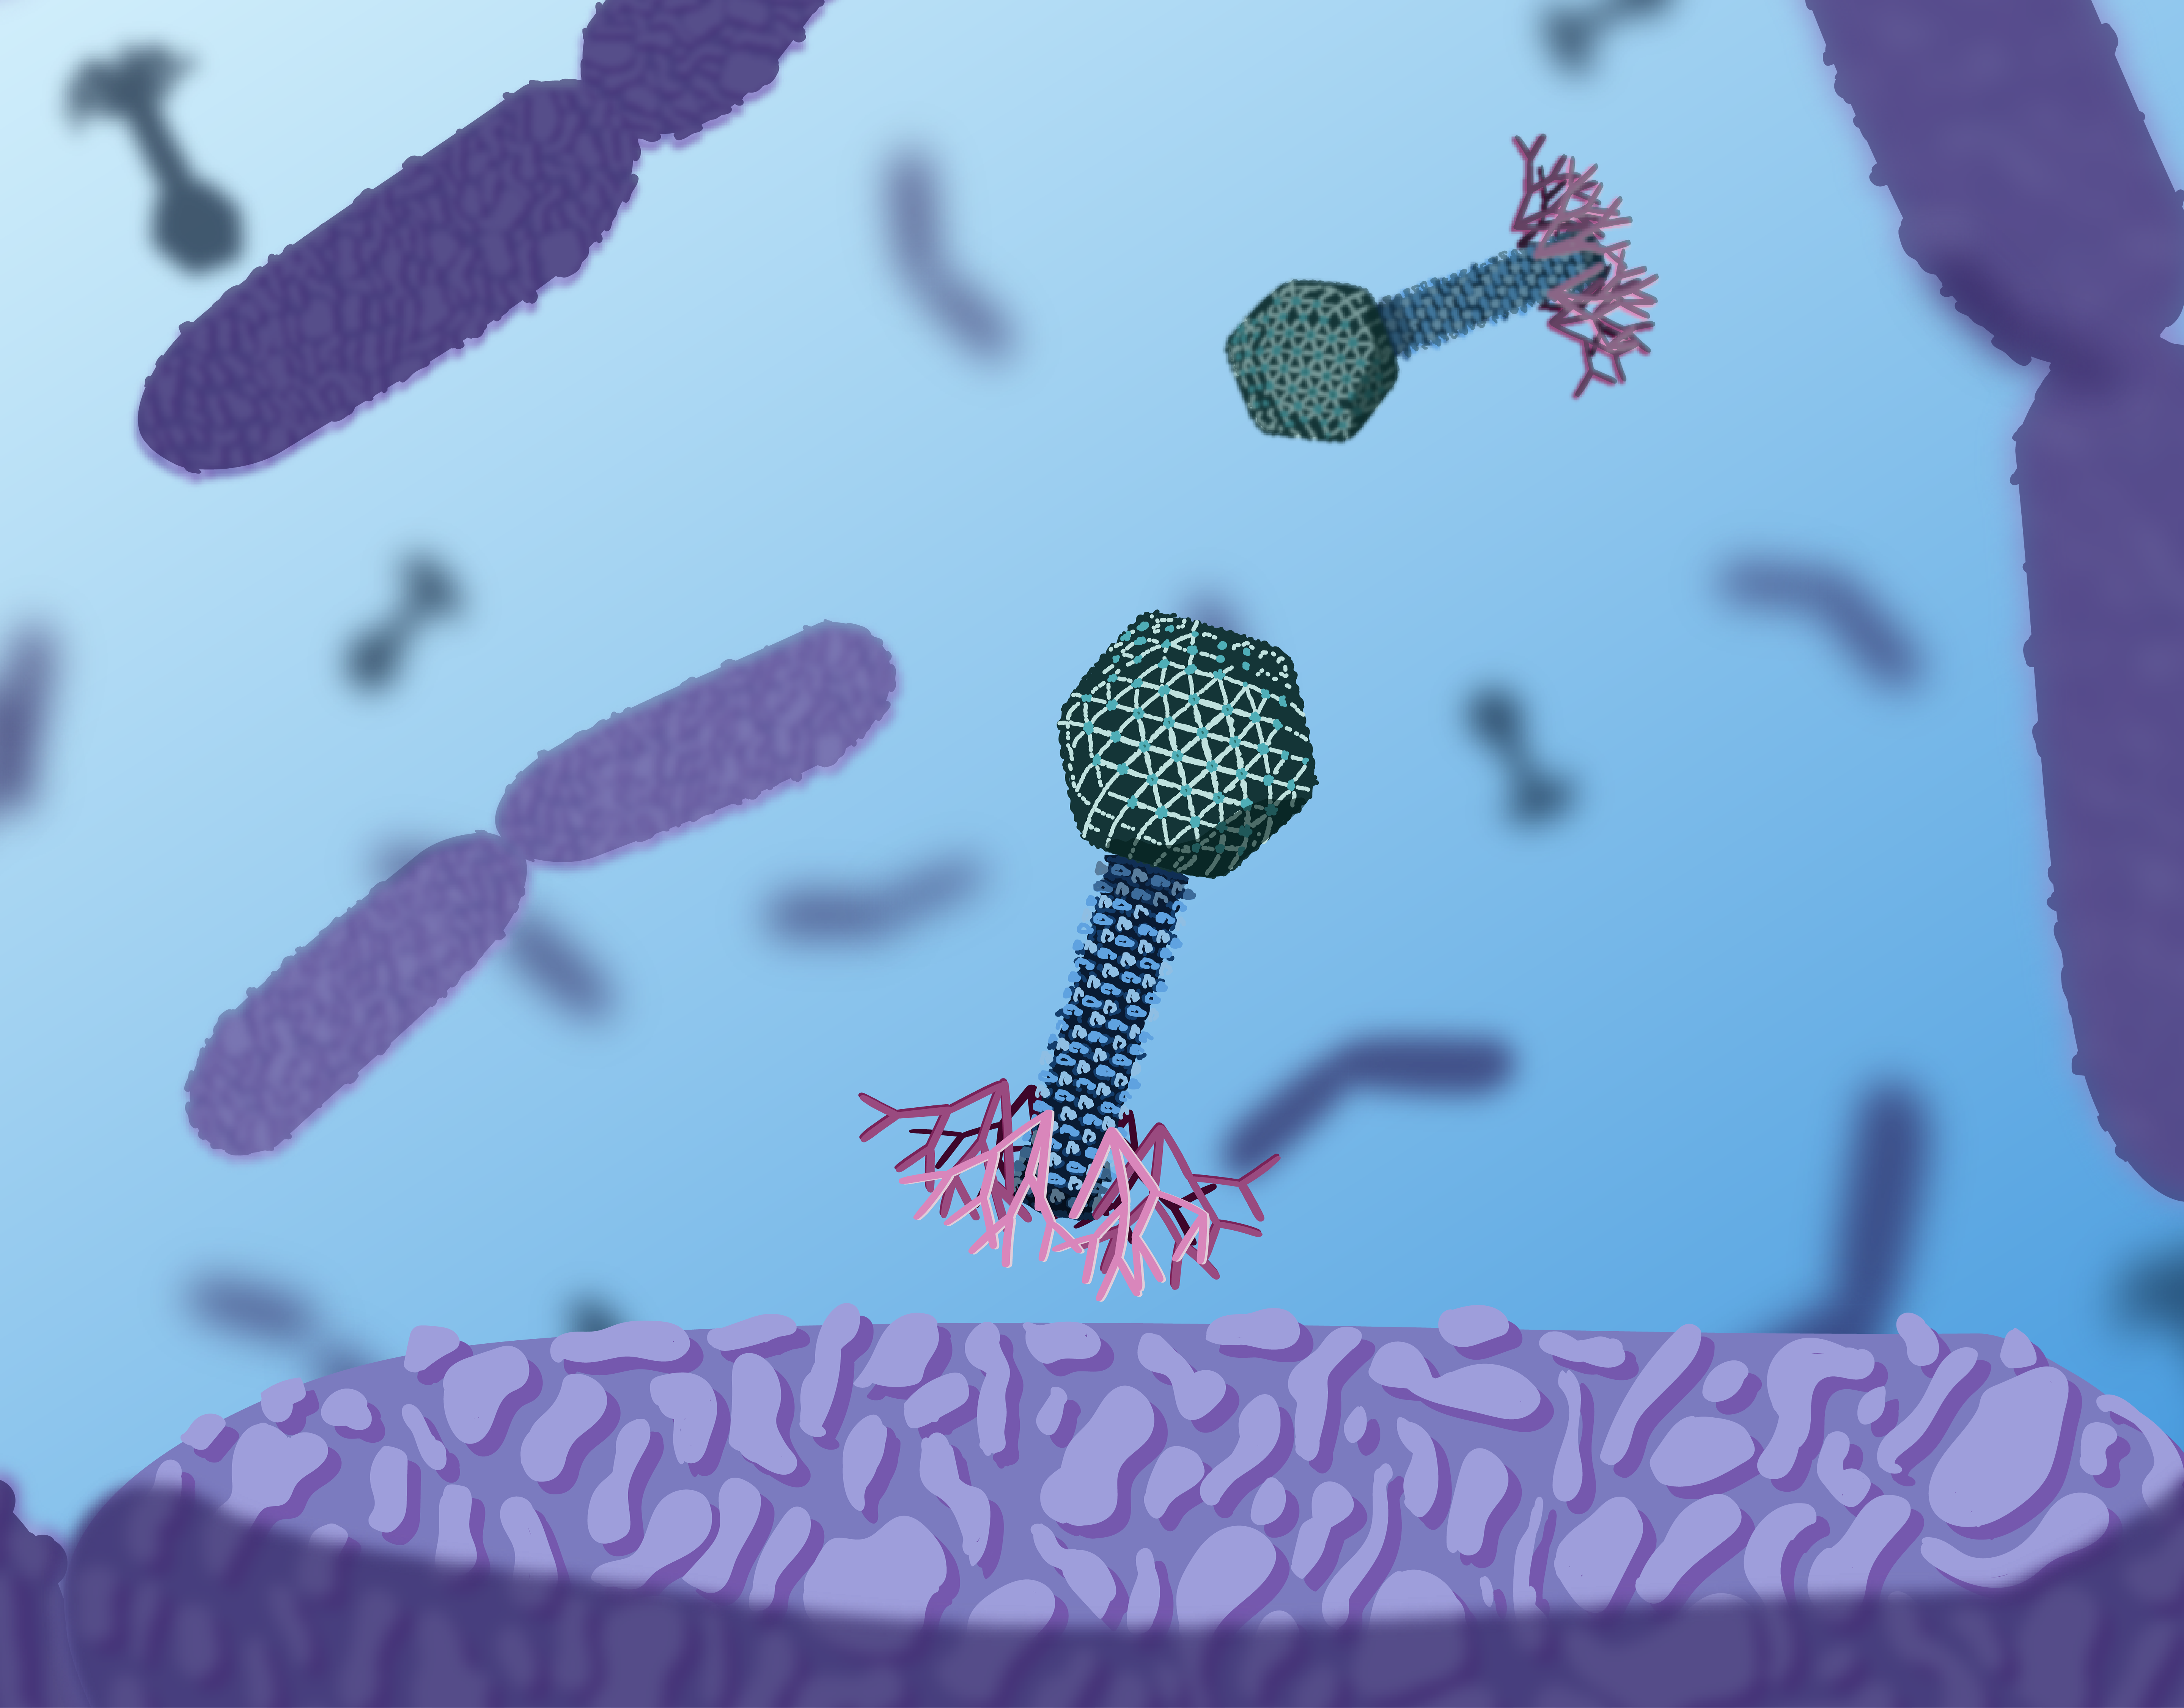
1. These bacteria are e coli bacteria. Just like us humans, E. coli can get infected by other microorganisms. This is what you see happening here. These microorganisms are the T4 bacteriophages.
2. When the T4 phage gets in close proximity of an E. coli bacterium, it can attach itself to the surface of the E. coli with its long feet fibres.
3. The long feet fibres bind to receptors on the E. coli's outer membrane. This triggers the conformation of the baseplate, revealing short tail fibres.
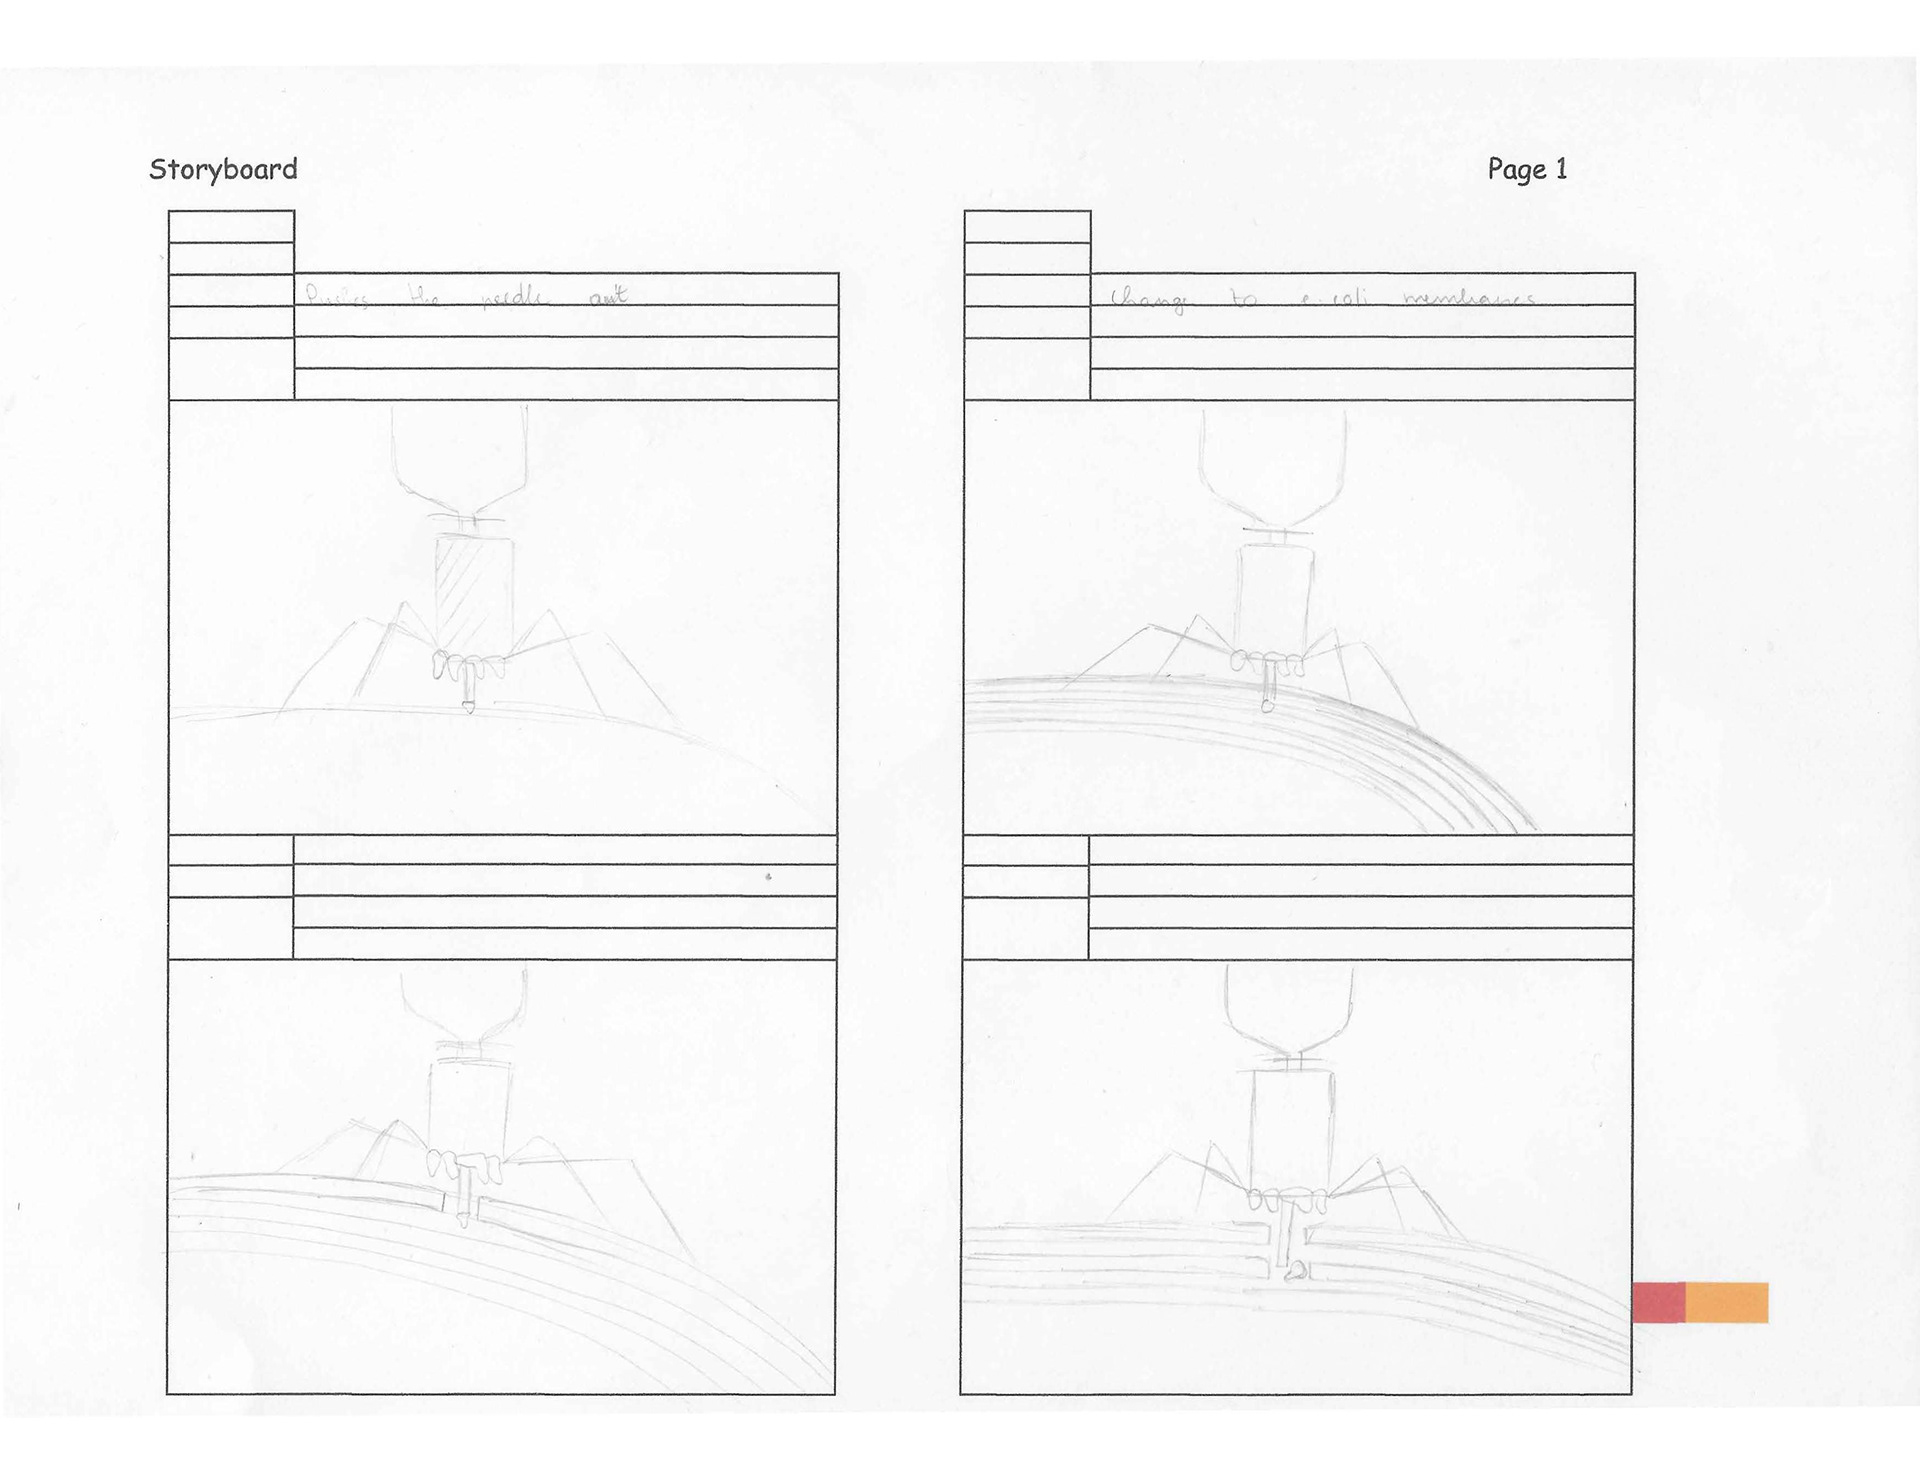
4. The extension of the short tail fibres initiates the tail contraction and reconfiguration of the neck collar. These transformations push the injection needle out of the contracted tail.
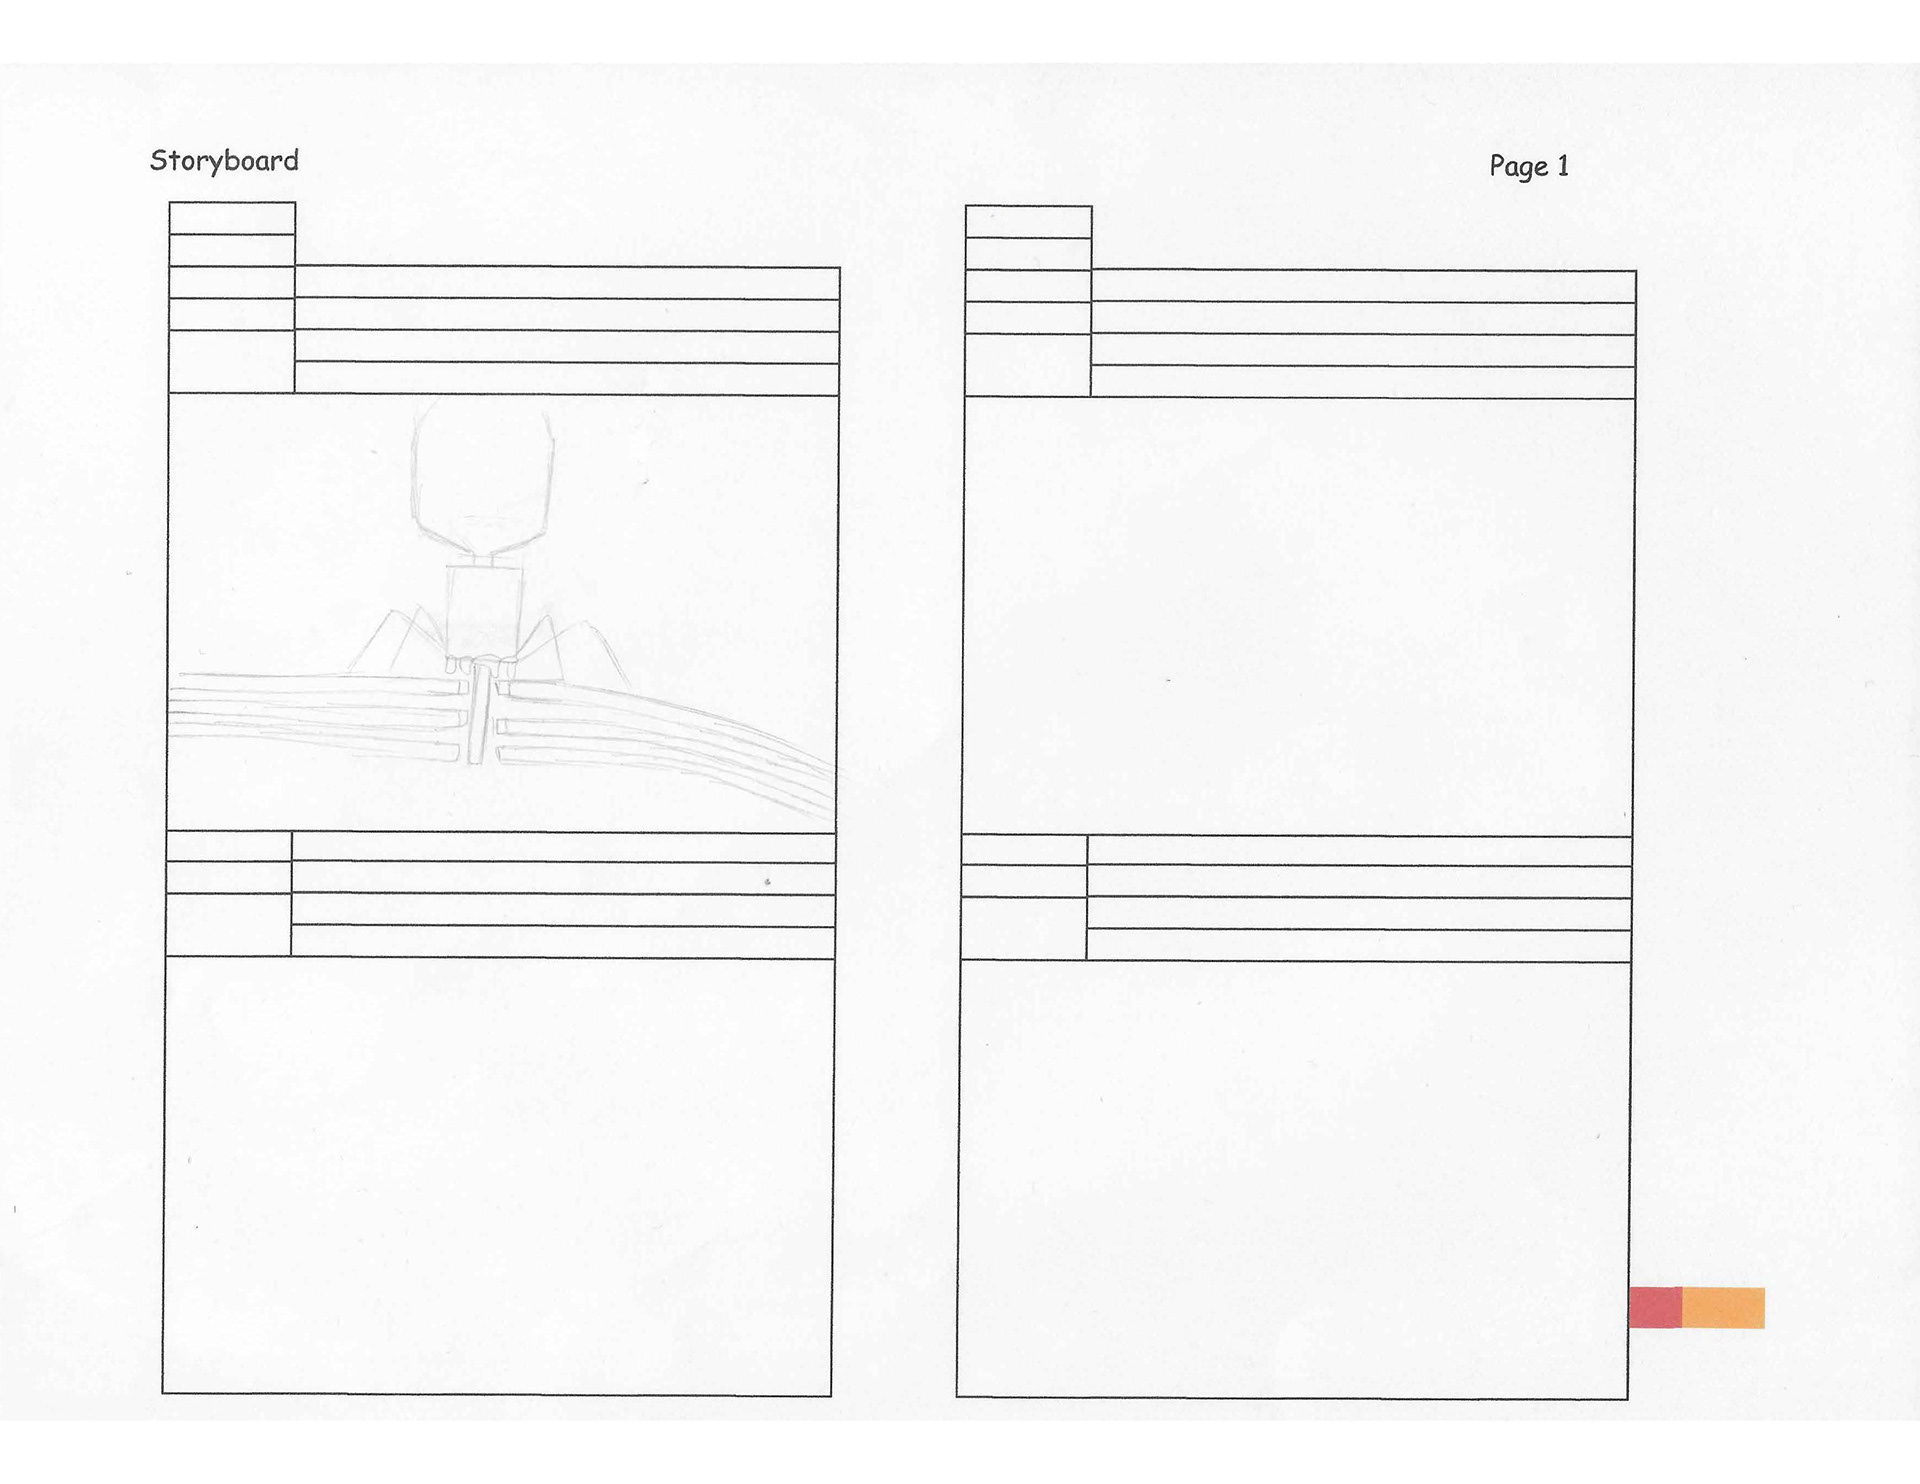
5. With the injection needle extended, the bacteriophage can pierce the E. coli’s surface. It needs to pass the outer membrane first. Once inside, the cap protein on the needle falls off and the bacteriophage can pierce the inner membrane.
6. Once there the bacteriophage can inject its DNA in the E. coli cell.

T4 Bacteriophage moving storyboard
This moving storyboard depicts how a T4 bacteriophage infects its host E. coli to reproduce. The animation depicts how the phage attaches itself to the host, the conformational changes it undergoes, and how it pierces the E. coli's membrane. T4 bacteriophage moving storyboard was based on the papers by Hu et al. (2015) and Leiman et al. (2003).

T4 Bacteriophage 3D volume from cryo-et data

Averaged, isolated baseplates from T4 Bacteriophage data

Animation of the flexible domains of the chemotaxis array in E. coli
This animation depicts the conformational changes that chemoreceptors of an E. coli bacterium undergo upon activation.
It demonstrates the zipping-effect of the MCPs when switching from the kinase-OFF to the kinase-ON state. Additionally, it shows the increased mobility of the P1 and P2 domains of CheA.